Why SaaS founders need an AI valuation calculator — not another ARR multiple widget
If you are evaluating the best AI valuation calculator for SaaS founders, you have probably already tried the alternatives: a revenue-multiple calculator that ignores churn, a spreadsheet DCF you built once and never updated, or a broker quote that arrived six weeks late and already felt stale. SaaS valuation in 2026 demands more precision than a single number. Buyers reward net retention above 110%, punish founder-led sales above 50% of revenue, and anchor to rule-of-40 in ways that compress multiples fast when growth slows below 20% year-over-year. The best AI valuation calculator for SaaS founders connects those unit-economics inputs to three institutional methods — Free Cash Flow to the Firm, Free Cash Flow to Equity, and EV/EBITDA — then uses AI to let you ask questions in plain English and see exact dollar impacts across every lens.
Exit Matters Chapter 6 explains why buyers pay premiums for recurring revenue, visible growth, and owner independence. Chapter 4 shows how to convert those cash flows into present value through discounted cash flow. Chapter 7 introduces the Blended View — weighting the three lenses based on whether you are running the company, raising a round, or preparing for acquisition. For SaaS founders, that blend typically over-weights EV/EBITDA when exit or fundraising is on the horizon, while keeping FCFF and FCFE visible so you never confuse enterprise value with what equity holders actually receive.
The 2026 SaaS multiple landscape — where your company sits on the band
Current SMB SaaS transaction data for businesses in the typical $1M to $25M ARR range shows a rational but wide band. At the low end, 3.0× ARR applies to companies with sub-20% growth, net revenue retention at or below 95%, top-customer concentration above 25%, and the founder still closing more than half of new business. These profiles look more like high-churn transaction businesses than durable subscription assets.
The median sits around 5.5× ARR for companies delivering 25 to 35% growth, net retention between 100 and 110%, repeatable sales motions, and rule-of-40 in the low-to-mid 30s. This is where most well-run vertical or horizontal SaaS businesses land with clean financials.
The high end — 9.0× ARR and occasionally higher — requires 35%+ growth, net retention above 110%, rule-of-40 above 40, low customer concentration, documented playbooks, and often a vertical or regulatory moat. Vertical SaaS serving healthcare, financial services, or public sector frequently trades at the upper end because switching costs and compliance burden create natural retention.
Premium drivers that expand the multiple include net revenue retention above 110%, gross margin above 75%, monthly churn below 5%, and ARR above $2M with rule-of-40 above 40. Discount drivers compress it: top-customer concentration above 25%, owner-led sales above 50% of revenue, and tech debt or legacy stack that signals reinvestment risk. Multiples compress fast when growth slows below 20% year-over-year — a reality the 2022–2024 correction made permanent.
The best AI valuation calculator does not hand you the median and walk away. It shows where you sit on the band, which drivers are pulling you up or down, and lets you model what fixing each one does to the blended answer.
Three institutional lenses — why one number is never enough for SaaS
FCFF — intrinsic value of the subscription machine
Free Cash Flow to the Firm projects unlevered cash the operations will generate, discounts at your weighted average cost of capital, and applies an illiquidity discount. For SaaS, WACC is often lower than asset-heavy businesses because subscription cash flows are relatively predictable once retention stabilizes. FCFF tells you whether the market multiple is rational — if intrinsic value sits well below the EV/EBITDA answer, you may be overvalued relative to cash-generation capacity; if it sits above, you have a reinvestment story worth telling growth investors.
FCFE — what founders and investors actually keep
Free Cash Flow to Equity accounts for venture debt, convertible notes, and future dilution. Most early-stage SaaS balance sheets carry more off-balance-sheet obligations than traditional debt. FCFE keeps the boundary clear between enterprise value and the slice belonging to founders and investors after all obligations. When modeling a Series B at a given pre-money, FCFE shows dilution impact per share — critical for founder decision-making.
EV/EBITDA — the comp anchor buyers use
Below roughly $10M ARR, most SaaS transacts on revenue because EBITDA is negative or near zero. Above that scale with positive EBITDA, EV/EBITDA becomes the cleanest comparison to financial-buyer comps. The multiple adjusts for the same factors driving the ARR band: retention, concentration, founder dependence, and rule-of-40. Chapter 6 decomposes the multiple into its drivers so you see exactly which metric moves the needle.
The Blended View combines all three with weights that shift based on persona — founder, capital-raiser, seller, buyer. Switching personas changes the headline number and supporting tiles in real time.
What AI adds that spreadsheets and static calculators cannot
The gap between a static model and an AI-powered valuation engine is the question loop. Founders think in scenarios, not cell references.
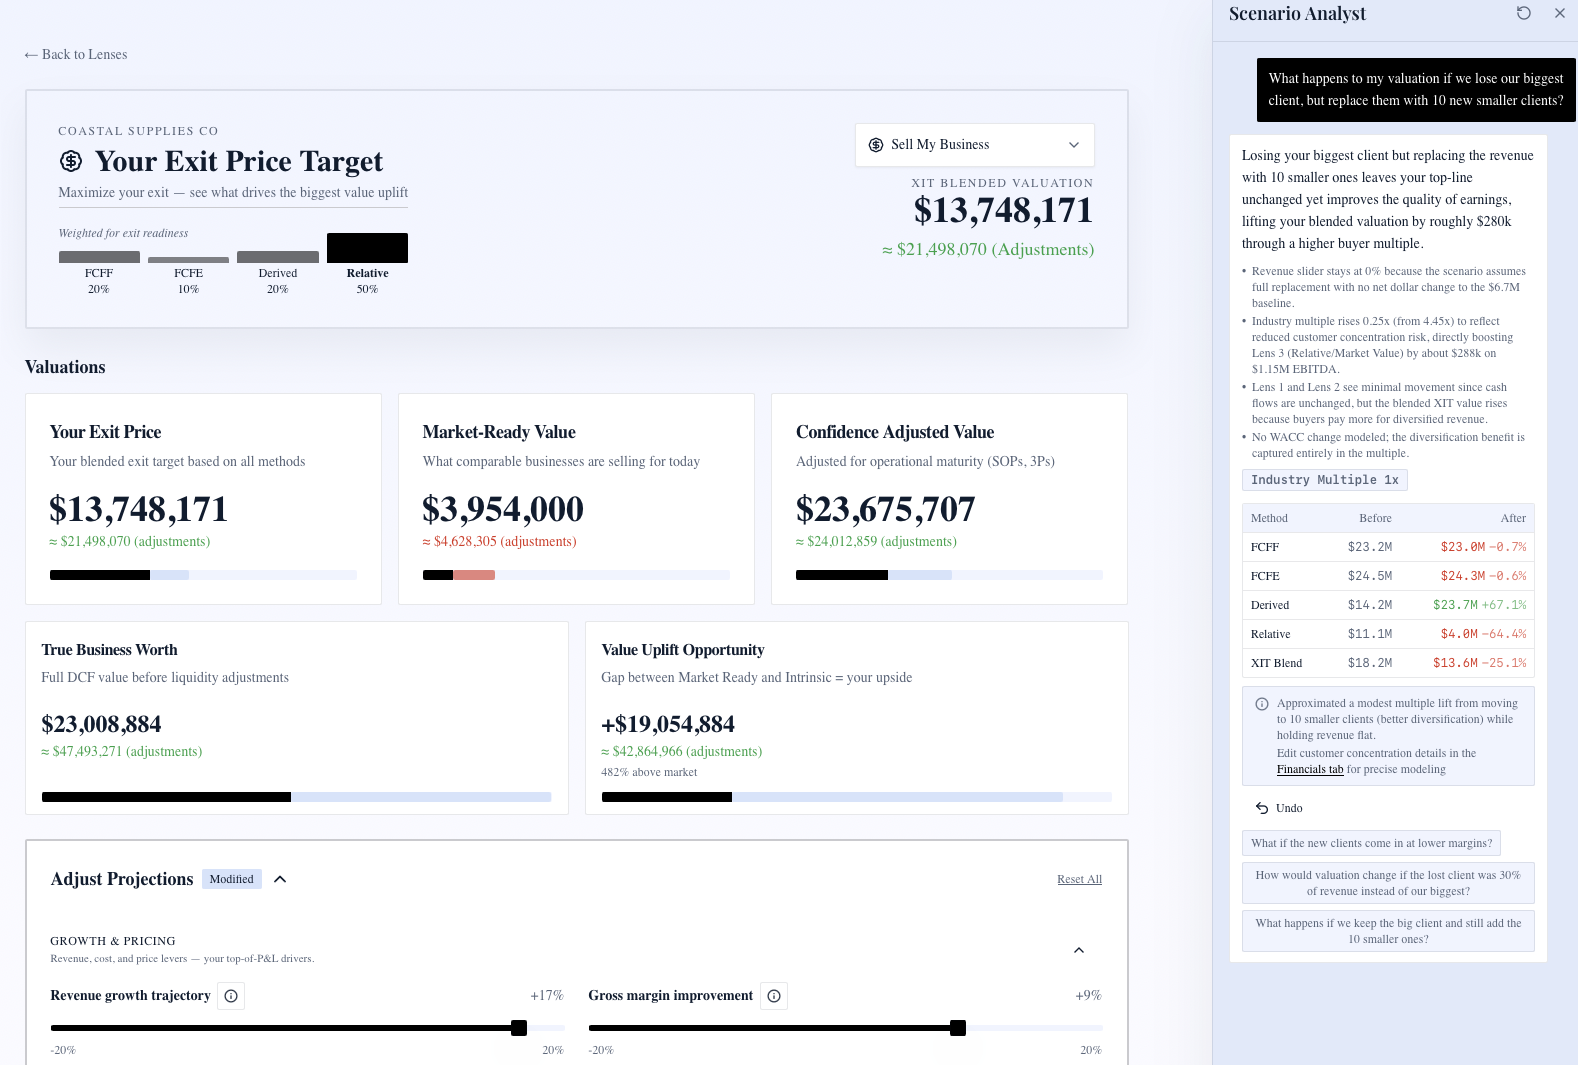
Plain-English scenario translation. "What if I raise prices 10% and churn ticks up 1%?" The AI Scenario Analyst maps that to exact inputs — ARPU, gross churn, net retention — and returns dollar impact across FCFF, FCFE, and EV/EBITDA with an explanation of which levers moved.
Rapid board prep. Test five scenarios in ten minutes: base case, aggressive growth, retention crisis, hiring two enterprise AEs, and a down-round fundraise. Each scenario updates the blended valuation and the supporting tiles.
Churn and retention sensitivity. Net retention is the single biggest input after growth rate. The tool lets you slider retention from 90% to 130% and watch the multiple band respond — making the cost of churn visible in dollars, not percentages.
Rule-of-40 visibility. Growth percent plus EBITDA margin percent surfaced alongside the multiple slider so you see the relationship explicitly. Post-2022 buyers are notably less forgiving below 30 than they were in 2021.
Founder-dependency modeling. When the founder closes more than half of new business, buyers apply key-person discount. Model the transition to a sales team and watch the multiple expand.
How XIT Matters delivers the best AI valuation calculator for SaaS founders
XIT Matters implements the full Exit Matters methodology with SaaS-specific inputs baked in.
The onboarding flow accepts QuickBooks, Xero, or manual entry in about ten minutes. Industry filter set to SaaS applies the 3.0× to 9.0× multiple band with premium and discount drivers displayed alongside the slider. The founder persona weights the Blended View toward growth and market comps; the capital-raiser persona emphasizes FCFE and dilution.
Approved features include the Blended Valuation Engine (FCFF, FCFE, EV/EBITDA), AI Scenario Analyst, Six Persona Views, Cost of Capital Simulator, Real-Time Slider Modeling, and EV/EBITDA Market Comps. Each maps directly to a SaaS founder workflow — board updates, fundraising prep, acquisition conversations, or internal strategic planning.
The Cost of Capital Simulator exposes credit spread, beta, debt paydown, and effective tax rate with SaaS-relevant benchmarks. Real-Time Slider Modeling lets you drag growth rate, retention, gross margin, and customer concentration and watch every method recalculate instantly.
For fundraising specifically, model a new round at various pre-money valuations and see FCFE per share before and after dilution. For exit prep, switch to the seller persona and compare your current blended valuation to a "ready for diligence" scenario with improved retention and reduced founder sales dependency.
A worked example — $4M ARR horizontal SaaS with mixed metrics
Consider a horizontal SaaS business at $4M ARR, 28% year-over-year growth, 102% net retention, 12% EBITDA margin, top customer at 18% of revenue, and the founder personally closing roughly 45% of net new bookings.
On the multiple band, this profile sits between low and median — growth above 20% supports the middle of the range, but net retention below 110% and founder sales dependency cap the upside. Rule-of-40 at 40 (28% growth + 12% margin) is exactly at the threshold buyers watch.
Running FCFF with SaaS-appropriate WACC and a 25% illiquidity discount produces an intrinsic value that likely sits below the pure revenue-multiple answer — signaling the market may be pricing growth optimism the cash flows do not yet support. FCFE after minimal venture debt shows equity holders a number closer to what a financial buyer would offer. EV/EBITDA at 5.0× on normalized EBITDA provides the comp anchor.
The Blended View under the founder persona lands between intrinsic and market — one number useful for internal planning. Switch to seller persona and EV/EBITDA weight increases, reflecting what an acquirer will anchor to.
Now ask the AI Scenario Analyst: "What if net retention improves to 112% through expansion revenue?" The model increases the multiple toward median-premium, lifts FCFF through higher projected cash flows, and shows the dollar delta on the blended headline. That single interaction tells the founder whether investing in customer success pays more than hiring another AE.
Strategic versus financial buyers — your range is usually the floor
Financial buyers — PE, growth equity — anchor to rule-of-40, cash-on-cash returns, and operational improvement during a five-to-seven-year hold. They rarely pay above the top of the comp range unless metrics are exceptional.
Strategic buyers — other SaaS companies acquiring for product, channel, or talent — can pay above the financial-buyer band when synergies justify it. The uplift can be 1× to 3× ARR depending on integration value. In those conversations, the XIT Matters range becomes your floor, not your ceiling.
The three-method blend gives you vocabulary for both conversations without guessing.
Common mistakes SaaS founders make with valuation tools
Relying on a single ARR multiple ignores the normalization that determines true EBITDA and the cash-flow quality buyers underwrite in diligence.
Using 2021 multiples in 2026 conversations destroys credibility. The market repriced sharply; buyers today reward balanced growth and profitability, not growth at all costs.
Ignoring founder dependency until diligence. If more than half of sales require you personally, model the transition cost before sharing any number with investors or acquirers.
Confusing enterprise value with equity value after venture debt and future dilution. FCFE exists precisely to prevent that mistake.
Skipping scenario modeling before board meetings. Investors expect you to know how churn, growth, and hiring affect value — not just the current headline.
The bottom line for SaaS founders choosing a valuation calculator
The best AI valuation calculator for SaaS founders runs the full FCFF, FCFE, and EV/EBITDA stack on your actual financials, applies the current 3.0× to 9.0× multiple band with your specific premium and discount drivers, and uses AI to translate plain-English what-ifs into exact lever moves across every method. XIT Matters delivers that engine free during beta, recalculates as your metrics evolve, and supports six persona views so the same business answers different questions for your board, your investors, and your acquirers. Stop guessing with a single multiple — start with a blended range you can defend.