Why e-commerce store owners need valuation software built for their category
Searching for the best business valuation software for e-commerce stores usually means you have outgrown the broker's back-of-napkin multiple or the aggregator term sheet that arrived with no explanation of how they got the number. E-commerce is not a generic small business. Channel concentration, inventory swings, repeat purchase dynamics, and gross margin structure drive valuation in ways that a revenue-multiple calculator will never capture. The best business valuation software for e-commerce stores runs three institutional methods — Free Cash Flow to the Firm, Free Cash Flow to Equity, and EV/EBITDA — on normalized earnings, applies the current 2026 SMB multiple band of 2.0× to 5.5× EBITDA, and lets you model the operational levers that expand or compress that band before you ever talk to a buyer.
Exit Matters Chapter 9 walks through the normalization steps that determine whether your EBITDA is defensible in diligence — inventory adjustments, owner compensation, one-time platform fees, and seasonal distortions. Chapter 7 introduces the Blended View that weights the three lenses based on your decision context. Chapter 18 addresses how technology and channel shifts reshape industry economics — directly relevant as Amazon policy changes, TikTok Shop emergence, and DTC platform evolution alter the risk profile buyers underwrite.
The 2026 e-commerce multiple band — 2.0× to 5.5× EBITDA
Current market data for SMB e-commerce businesses in the typical $1M to $20M revenue range shows a band that reflects post-aggregator reality. At the low end, 2.0× EBITDA applies to single-channel Amazon FBA operations with sub-25% gross margin, heavy inventory, and no meaningful brand equity beyond the listing. These businesses trade closer to asset sales than brand acquisitions.
The median sits around 3.5× EBITDA for brands with diversified channels, gross margins above 30%, and some repeat customer revenue. This is where most growing DTC brands land when financials are clean and the owner is not the sole operator.
The high end — 5.5× EBITDA — requires repeat customer revenue above 40%, a branded product portfolio that commands pricing power, diversified channel mix beyond any single platform, and inventory turnover that does not trap working capital.
Premium drivers include repeat customer revenue above 40%, a branded product portfolio, and diversified channel mix beyond Amazon. Discount drivers compress the multiple: single-channel dependency (Amazon FBA only), gross margin below 25%, and inventory-heavy operations with poor turnover. Aggregator demand cooled in 2024–25; 2026 multiples rebuilt around proven brand strength rather than growth alone.
The best valuation software does not give you the median and stop. It shows where your brand sits, which drivers are pulling you up or down, and lets you model improvements before going to market.
Three institutional lenses — applied to e-commerce operations
FCFF — intrinsic value after inventory and reinvestment
Free Cash Flow to the Firm starts with normalized EBITDA, subtracts taxes, adds back non-cash charges, and subtracts reinvestment — replacement CapEx (usually modest for pure-play e-commerce) and the change in working capital. Inventory is the dominant working-capital line. Improving turns or clearing aged stock releases cash that flows directly into higher FCFF. The method projects five years forward, discounts at WACC, and applies an illiquidity discount. The result is the intrinsic value of the operations independent of financing choices.
FCFE — what the owner actually keeps
Free Cash Flow to Equity accounts for inventory financing, merchant cash advances, revolving lines tied to stock, and any SBA or equipment debt. Many e-commerce brands look healthy on EBITDA but carry obligations that reduce equity cash flow. FCFE makes that visible — the number that tells you what you could take home or reinvest without starving growth.
EV/EBITDA — what acquirers actually pay
Market multiples anchor to comparable transactions. For 2026 SMB e-commerce, the range is 2.0× to 5.5× on normalized EBITDA. Your specific multiple expands or compresses based on channel concentration, repeat purchase rate, gross margin, brand strength, and working-capital quality. Amazon FBA dependency above 70% commonly compresses the multiple by roughly half a turn. Diversifying 20% of revenue to other channels usually earns most of that back.
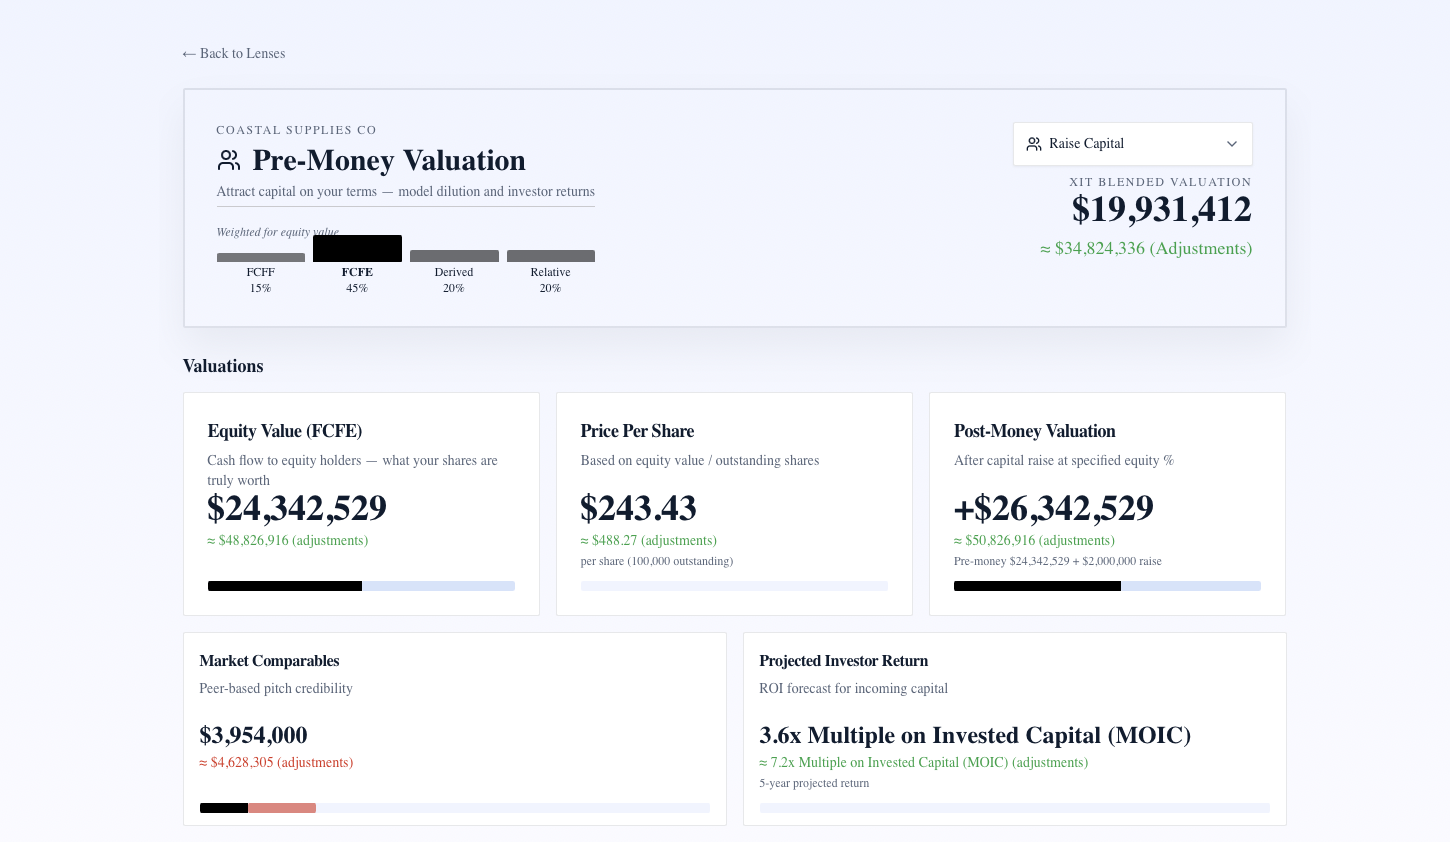
The Blended View combines all three with owner-weighted priorities — more cash-flow lenses for operators holding the business, more market weight when preparing for sale.
What separates e-commerce valuation software from generic tools
Channel mix modeling. Slider Amazon, Shopify DTC, wholesale, and retail percentages and watch the multiple respond. Buyers underwrite platform risk explicitly; software should too.
Repeat customer revenue impact. Rates above 40% turn a transactional brand into something closer to a recurring-revenue asset. Model the lift from loyalty programs, subscriptions, or improved post-purchase flows.
Inventory and working capital. DIO, aged inventory carve-outs, and seasonal normalization appear as live inputs affecting FCFF directly — not buried in a footnote.
Gross margin sensitivity. Sub-25% margins compress multiples; above 40% with branded products supports the high end. Drag the margin slider and see every method respond.
Living recalculation. E-commerce books change monthly — ad spend shifts, inventory builds, returns spike. Static valuations expire before they arrive. The right software recalculates instantly.
AI scenario engine. Ask "What if I shift 30% of Amazon revenue to Shopify DTC over 18 months?" and see channel-risk compression reverse alongside FCFF improvement from higher margins.
How XIT Matters delivers the best business valuation software for e-commerce stores
XIT Matters implements the Exit Matters methodology with e-commerce-specific inputs.
Set industry filter to e-commerce and the 2.0× to 5.5× multiple band loads with premium and discount drivers displayed alongside the slider. Connect QuickBooks or Xero — most e-commerce brands run through one of these — or enter financials manually in about ten minutes.
Approved features map directly to e-commerce workflows: Blended Valuation Engine, AI Scenario Analyst, Real-Time Slider Modeling for channel mix and gross margin, EV/EBITDA Market Comps with industry band, and Cost of Capital Simulator for WACC inputs.
The owner persona weights the Blended View toward operational cash flow. Switch to seller persona when preparing for acquisition and EV/EBITDA weight increases to match buyer anchoring behavior.
Normalization guidance follows Chapter 9: adjust owner compensation, carve aged inventory, normalize one-time platform fees, and smooth seasonal spikes before running the three methods. The dashboard surfaces these as editable inputs rather than hidden assumptions.
A worked example — $6M revenue DTC skincare brand
Consider a DTC skincare brand at $6M revenue, $1.1M normalized EBITDA (18% margin), 35% repeat customer revenue, 55% Shopify DTC / 35% Amazon / 10% wholesale channel mix, and inventory turnover at 4.2× annually.
On the multiple band, repeat revenue below 40% caps upside slightly, but diversified channels (no single platform above 70%) and healthy margins support the median. Gross margin at 62% — strong for physical product — adds premium support.
FCFF with e-commerce WACC and working-capital normalization produces intrinsic value reflecting inventory efficiency. FCFE after a $400K inventory line of credit shows equity holders a lower but honest walk-away. EV/EBITDA at 3.8× on normalized EBITDA sits at median for the profile.
The Blended View gives one actionable number for internal planning. Ask the AI Scenario Analyst: "What if repeat customer revenue reaches 45% through a subscription refill program?" The model lifts the multiple toward premium, improves FCFF stability, and shows the dollar delta — telling the owner whether subscription investment beats another ad channel.
When to sell versus when to optimize — what the software reveals
If channel concentration, margin, and repeat revenue all sit at discount drivers, the software often shows that twelve months of operational work returns more than today's offer. If you already sit at premium drivers with clean books, current multiples are reasonable — waiting for 2021-style aggregator pricing is unrealistic.
Chapter 9 frames these as tactical decisions with measurable ROI. The valuation software quantifies each tactical move in dollars on the blended headline.
Common e-commerce valuation mistakes
Using revenue multiples when EBITDA is the buyer language above $2M revenue. SDE works for tiny owner-operator shops; scaling brands need EBITDA normalization.
Ignoring inventory in the walk-away number. A $5M offer with $800K of aged inventory the buyer carves out is a $4.2M deal — model it first.
Treating Amazon ranking as brand equity. Platform dependency is a discount driver, not an asset, until you diversify.
Skipping working-capital peg modeling. Deals die when net working capital adjustments surprise the seller at closing.
Using stale valuations. E-commerce metrics shift quarterly; a living model beats a point-in-time report every time.
Integrating valuation software into your e-commerce operating rhythm
The best business valuation software for e-commerce stores earns its place when it becomes part of how you run the brand — not a report you pull once before a broker call. Connect accounting after month-end close and review the blended headline alongside ad ROAS, contribution margin, and inventory turns. When a channel shift or SKU rationalization moves EBITDA, the valuation should move the same week.
Quarterly, run three scenarios in the AI Scenario Analyst: base case, aggressive repeat-revenue growth, and a downside where your largest channel tightens fees or policy. Compare FCFE walk-away under each. That fifteen-minute ritual tells you whether to reinvest in DTC, clear aged inventory, or accelerate a sale window while multiples favor your profile.
Before any aggregator outreach or broker engagement, export the three-method range and your position on the 2.0× to 5.5× band with the premium and discount drivers annotated. Buyers and brokers open low when sellers cannot defend the math. Software that makes your channel mix, repeat rate, and inventory efficiency visible in dollars — not adjectives — changes the opening frame of every conversation.
Brand owners who treat valuation as a monthly operating metric — not a pre-sale chore — catch margin erosion, channel risk, and inventory bloat before those issues compress the multiple in a live negotiation. That discipline is what separates founders who exit on their timeline from owners who accept the first offer because they never tracked the scoreboard.
If your brand sells through both owned DTC and marketplace channels, model fee compression and return-rate spikes as explicit scenarios before a buyer does. The best business valuation software for e-commerce stores makes those shocks visible in FCFF and EV/EBITDA simultaneously — so you can decide whether to fix operations or accelerate a sale from strength, not from surprise. That visibility is the difference between reacting to a lowball offer and leading with a defended range.
The bottom line for e-commerce store owners
The best business valuation software for e-commerce stores models channel risk, repeat revenue, inventory working capital, and gross margin as first-class inputs — runs FCFF, FCFE, and EV/EBITDA on normalized earnings — and applies the current 2.0× to 5.5× multiple band with your specific premium and discount drivers. XIT Matters delivers that engine free during beta, recalculates as your books evolve, and uses AI to translate operational what-ifs into exact dollar impacts. Know your number before the broker calls — and know which levers move it most.