How much is my small business worth 2026? The range beats the guess
If you are asking how much is my small business worth 2026, you are not alone — SBA data shows millions of owner-operated firms approaching succession, partnership changes, or capital decisions without a defensible number. The wrong answer comes from a revenue multiple pulled off a forum, a broker's verbal estimate with no methodology, or a stale appraisal from a different economic cycle. The right answer uses the same three institutional methods professional buyers and lenders underwrite — Free Cash Flow to the Firm, Free Cash Flow to Equity, and EV/EBITDA — blended into a range that respects your industry, normalized earnings, and whether you are tracking wealth, raising capital, or prepping a sale.
Exit Matters Chapter 3 applies the 80/20 rule: capture directional accuracy you can act on today rather than perfect precision delivered months from now. Chapter 7 introduces the Blended View — three lenses weighted toward the decision in front of you. How much is my small business worth 2026 is a question with three valid answers that converge into one decision compass when you run the math on your actual books.
Why 2026 is a different valuation year for SMB owners
After the 2022–2024 reset, 2026 buyers underwrite durability over hype. Predictable cash conversion, recurring or repeat revenue, documented operations that survive owner transition, and clean financials earn premium positions on industry multiple bands. Growth without margin discipline or owner-independent delivery compresses multiples even when top line looks healthy.
Interest rates and credit availability affect buyer pools and leverage — cost of capital inputs in FCFF matter again. Owners who ignored WACC when money was free must now model it.
Industry bands diverge. SaaS, e-commerce, professional services, restaurants, and contracting each carry distinct low/median/high multiples on normalized EBITDA in the $1M–$25M EBITDA Main-Street to lower-middle-market band. A national "small business multiple" statistic ignores that structure.
Generic 2026 calculators that ignore industry and earnings quality misprice most owners by a full turn or more.
Start with normalized earnings — the input every method shares
Before FCFF, FCFE, or EV/EBITDA runs:
Replace owner compensation with market-rate cost for roles you perform.
Remove one-time revenue and expenses that will not repeat.
Adjust working capital for unusual inventory, receivables, or payables patterns.
Separate personal expenses run through the business.
Normalized EBITDA anchors EV/EBITDA and feeds cash-flow projections in FCFF and FCFE. Skip this step and diligence rebuilds your number downward — or kills the deal.
Three methods — how much is my small business worth under each lens
FCFF (cash flow to the firm) projects unlevered cash the operations generate, discounted at WACC with illiquidity adjustment for private businesses. Answers intrinsic value of the machine independent of how you financed it.
FCFE (cash flow to equity) subtracts debt service and reinvestment to show what equity holders receive — the wealth and walk-away lens. Critical when debt, seller notes, or partner buyouts affect personal outcomes.
EV/EBITDA (what buyers pay) applies your industry multiple band to normalized EBITDA. Low, median, and high positions reflect premium and discount drivers — recurring revenue, concentration, owner dependency, growth visibility.
The Blended View combines the three under owner persona weighting for operating decisions — or seller, buyer, capital-raiser personas when the conversation shifts.
Industry bands — where 2026 SMB multiples cluster
Select your industry in XIT Matters to load the appropriate band. Examples from curated SMB transaction data:
SaaS: 3.0×–9.0× on EBITDA or ARR context; net retention and rule-of-40 drive position.
E-commerce: 2.0×–5.5×; repeat purchase, channel mix, margin quality.
Professional services / consulting: 2.5×–5.5×; retainer mix and bench depth.
Digital agencies: 2.5×–6.5×; productized retainers above 60 percent premium.
Restaurants: 1.8×–4.0×; multi-unit and lease terms matter.
Contracting / landscaping: 2.5×–6.0×; recurring service contracts premium.
Your position on the band matters more than the band itself — premium drivers expand multiples; discount drivers compress.
Persona weighting — same business, different 2026 answer
Owner (wealth tracking). FCFF and FCFE weighted for reinvestment and distribution decisions.
Seller (exit prep). EV/EBITDA weighted; FCFE for walk-away after structure.
Buyer (acquisition target). Financial underwrite lens — stress-test their opening bid.
Capital-raiser (debt or equity). Blend supports lender and investor conversations with defensible range.
How much is my small business worth 2026 depends on who is asking and why — persona-aware blending prevents using the wrong headline in the wrong meeting.
Scenario planning — measure fixes before you spend
Once baseline range exists, model operational improvements:
Price increase with retention held flat.
Hire that reduces owner delivery hours.
Working-capital normalization releasing cash.
Customer diversification reducing concentration.
Each scenario recalculates FCFF, FCFE, EV/EBITDA, and blended headline — prioritize fixes by dollar delta per investment dollar.
Common mistakes when estimating 2026 small business value
Using revenue multiples when margin and capital intensity vary.
Ignoring industry band — wrong benchmark, wrong range.
Confusing enterprise value with personal walk-away.
Relying on pre-2022 comp anecdotes — market reset changed buyer behavior.
One-time valuation instead of living quarterly re-runs as books improve.
Step-by-step — how to answer how much is my small business worth 2026
Step 1: Gather financials. Two years of P&L, current balance sheet, trailing twelve-month cash flow. QuickBooks or Xero compatible import or manual entry both work.
Step 2: Normalize EBITDA. Owner compensation to market, remove one-time items, adjust working capital anomalies. This step determines whether buyers trust your number in diligence.
Step 3: Select industry band. Load low, median, and high multiples for your category — SaaS, e-commerce, restaurant, agency, consulting, contracting, or other supported industries.
Step 4: Run FCFF, FCFE, and EV/EBITDA. Review convergence — wide spread signals assumptions to refine; tight convergence signals defensible range.
Step 5: Choose persona weighting. Owner for wealth tracking, seller for exit prep, capital-raiser for funding conversations, buyer for acquisition target rehearsal.
Step 6: Model top two value drivers. Owner dependency, concentration, recurring mix, working capital — rank fixes by blended delta.
Step 7: Re-run quarterly. Treat valuation as living scoreboard, not one-time event. Progress on drivers should move your range measurably within twelve months.
This workflow takes about ten minutes on first pass and less on quarterly refresh — far faster than waiting weeks for a static appraisal that expires before your decision arrives.
Size tiers — how revenue scale changes buyer expectations
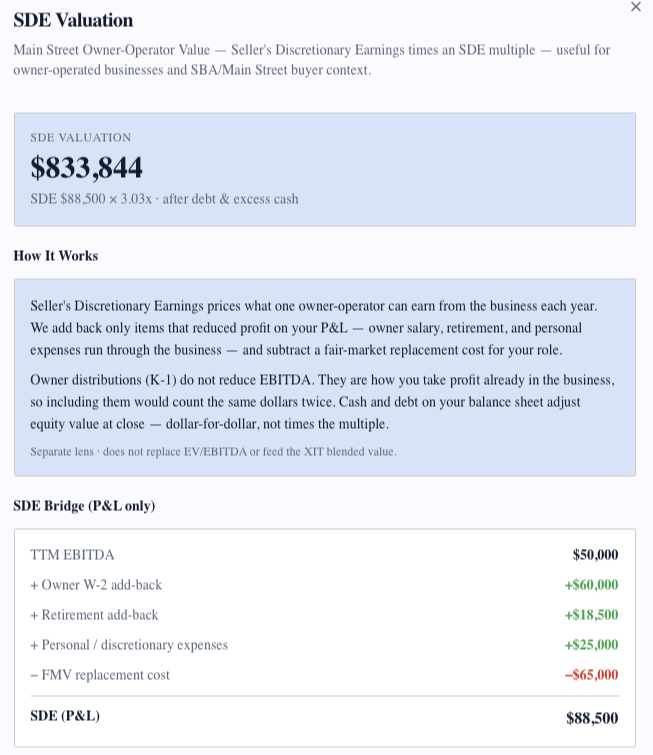
Sub-$1M revenue owner-operated businesses often transact on SDE-style thinking even when you report EBITDA — buyers replace your labor entirely. $1M–$5M revenue firms face mixed buyer pools: individual acquirers, search funds, small PE. $5M–$25M EBITDA attracts financial buyers who speak EV/EBITDA fluently and run full diligence. How much is my small business worth 2026 depends partly on which pool will likely buy you — persona and band selection should reflect that reality.
Businesses with strong recurring or repeat revenue, documented SOPs, and management bench trade toward median or premium on their band regardless of absolute size. Businesses with lumpy revenue, heavy owner dependency, and messy books compress toward low band even at $10M revenue. Size opens doors; quality determines price.
Red flags that compress 2026 small business valuations
Customer concentration above 25 percent in a single account. Owner still primary rainmaker and delivery lead with no succession plan. Revenue down year-over-year without documented turnaround plan. Gross margin erosion without pricing or cost response. Working-capital deterioration — rising DSO, aged inventory, stretched payables masking cash stress. Pending litigation or regulatory exposure. Each flag maps to discount drivers on your industry band; fix the two largest before go-to-market or capital raise.
Green flags that expand 2026 small business valuations
Recurring or repeat revenue above 40 percent where applicable to your model. No customer above 15 percent of revenue. Documented operations that run without owner on daily decisions. Clean auditable financials with consistent accounting policies. Twelve or more months of growth visibility or stable profitable plateau. Proactive capital structure — reasonable debt service coverage. Model each green flag as a scenario to quantify multiple expansion in dollars, not slogans.
When you still need formal appraisal
Litigation, divorce, IRS estate filings, SBA lender requirements at close, and adversarial partner buyouts need CPA-signed opinions. Self-served three-method valuation delivers 80 percent directional accuracy for operating and negotiation prep — Exit Matters Chapter 3 math — but not binding artifacts. Budget formal work when stakes are binding; use XIT Matters for everything leading up to it.
Industry examples — how 2026 bands differ in practice
A profitable SaaS firm with 85 percent recurring revenue and net revenue retention above 100 percent may sit toward the upper half of the 3.0×–9.0× band when growth and churn metrics hold. A restaurant with strong local brand but thin margins may land near 2.0×–2.5× on normalized EBITDA despite busy dining rooms. An e-commerce brand with owned customer data and repeat purchase above 40 percent trades differently from a dropship operator on the same revenue line. How much is my small business worth 2026 is not one national average — it is your normalized earnings times your industry band position, validated by whether FCFF and FCFE converge on a similar equity story.
Run your numbers on the correct industry record before comparing yourself to a peer in a different category. Misapplied benchmarks are the fastest way to misprice a negotiation or a capital raise. When in doubt, run two industry scenarios side by side and let FCFF and FCFE convergence tell you which profile fits your books.
Taxes and structure — why FCFE matters as much as EV
Enterprise value headlines make good conversation; FCFE tells you what funds your next chapter after debt, taxes, and transaction costs. S-corporation and LLC owners often focus on EBITDA multiples while ignoring basis, accumulated depreciation, and whether the deal is structured as asset or stock sale. How much is my small business worth 2026 for operating decisions still requires FCFE — especially when you are deciding whether to sell, recapitalize, or distribute excess cash this year. Model walk-away under your CPA's likely structure assumptions before you commit to a timeline. Even a directional FCFE range prevents the classic mistake of celebrating a headline EV that leaves less in your account than you need. Re-run FCFE whenever debt, distributions, or tax estimates change — how much is my small business worth 2026 is a living question for operators, not only sellers, and it deserves quarterly refresh.
The bottom line — how much is my small business worth 2026
How much is my small business worth 2026? A defensible answer is a three-method range anchored to your industry multiple band on normalized EBITDA — validated by FCFF and FCFE convergence — updated as your financials improve. XIT Matters runs that stack in ten minutes, switches persona weighting for your decision, and models operational fixes in dollars on the blended headline. Free during beta. Stop guessing from revenue multiples. Start knowing your 2026 range.